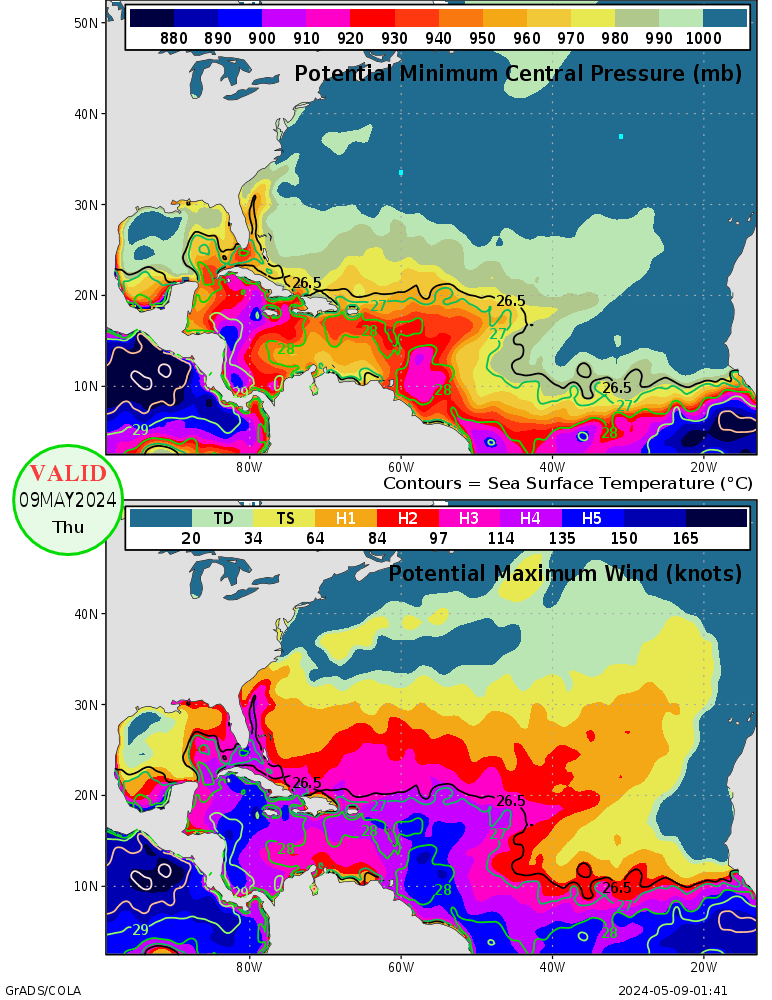
NORTH ATLANTIC TROPICAL MAPS
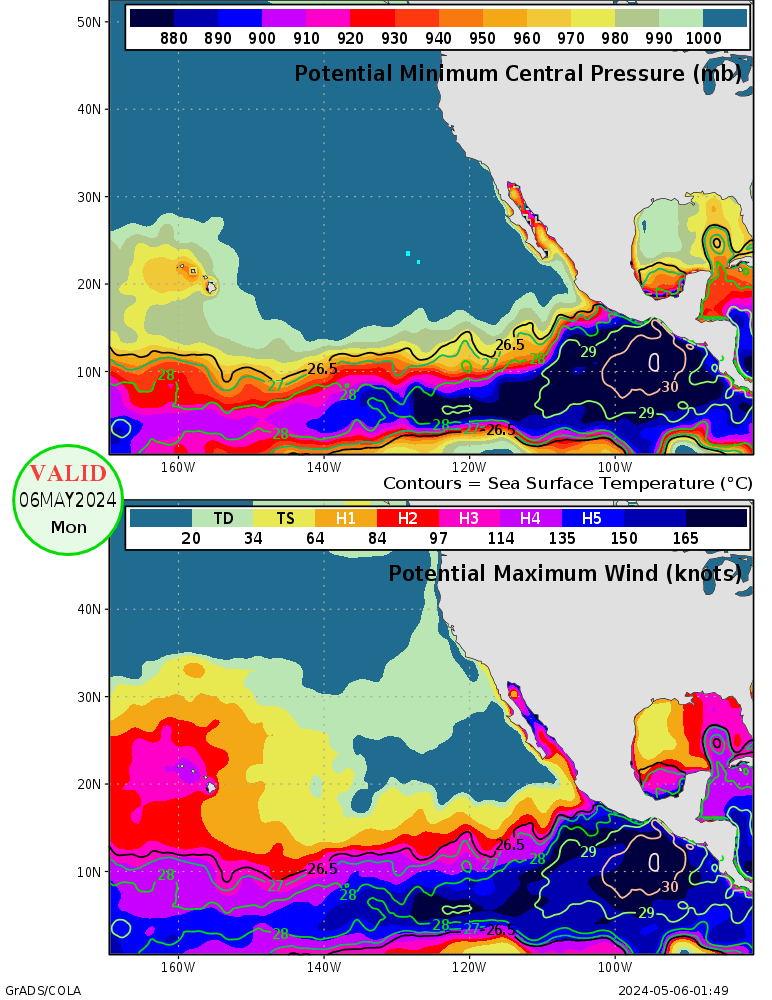
Maximum Potential Hurricane Intensity
200mb Vertical Velocity (green areas represent upward motion associated with the MJO):
24 HR 200 MB TROPICAL WIND FORECAST
48 HR 200 MB TROPICAL WIND FORECAST
74 HR 200 MB TROPICAL WIND FORECAST
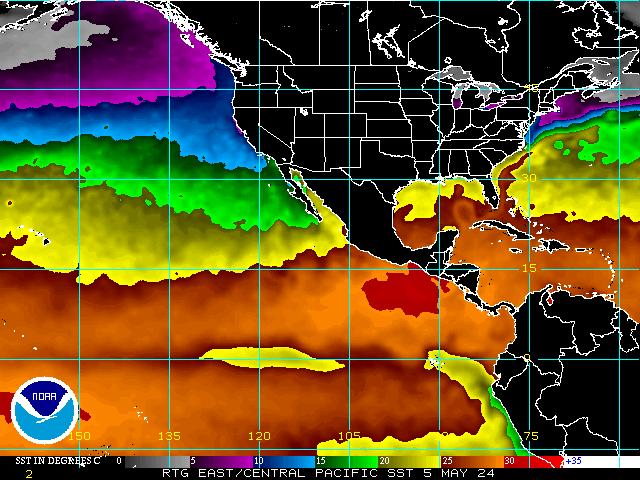
EASTERN PACIFIC TROPICAL MAPS
MJO Two Week Forecast
500-hPa HT Anomalies
850 mb Vector Wind Anomalies